This library enables debugging of SketchUp Ruby scripts, allowing you to set breakpoints, step through code, inspect variables, and evaluate expressions.
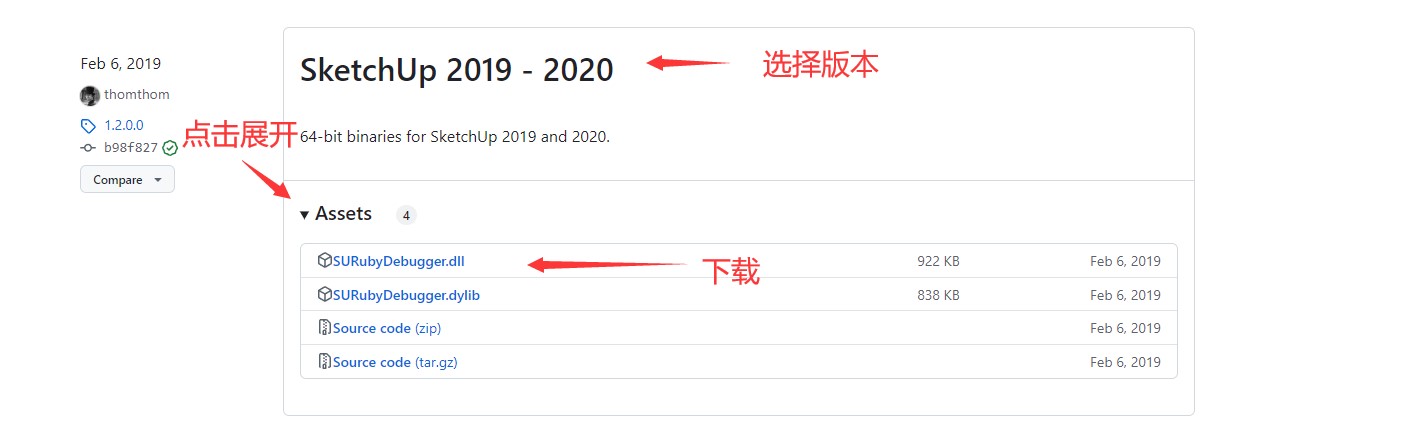
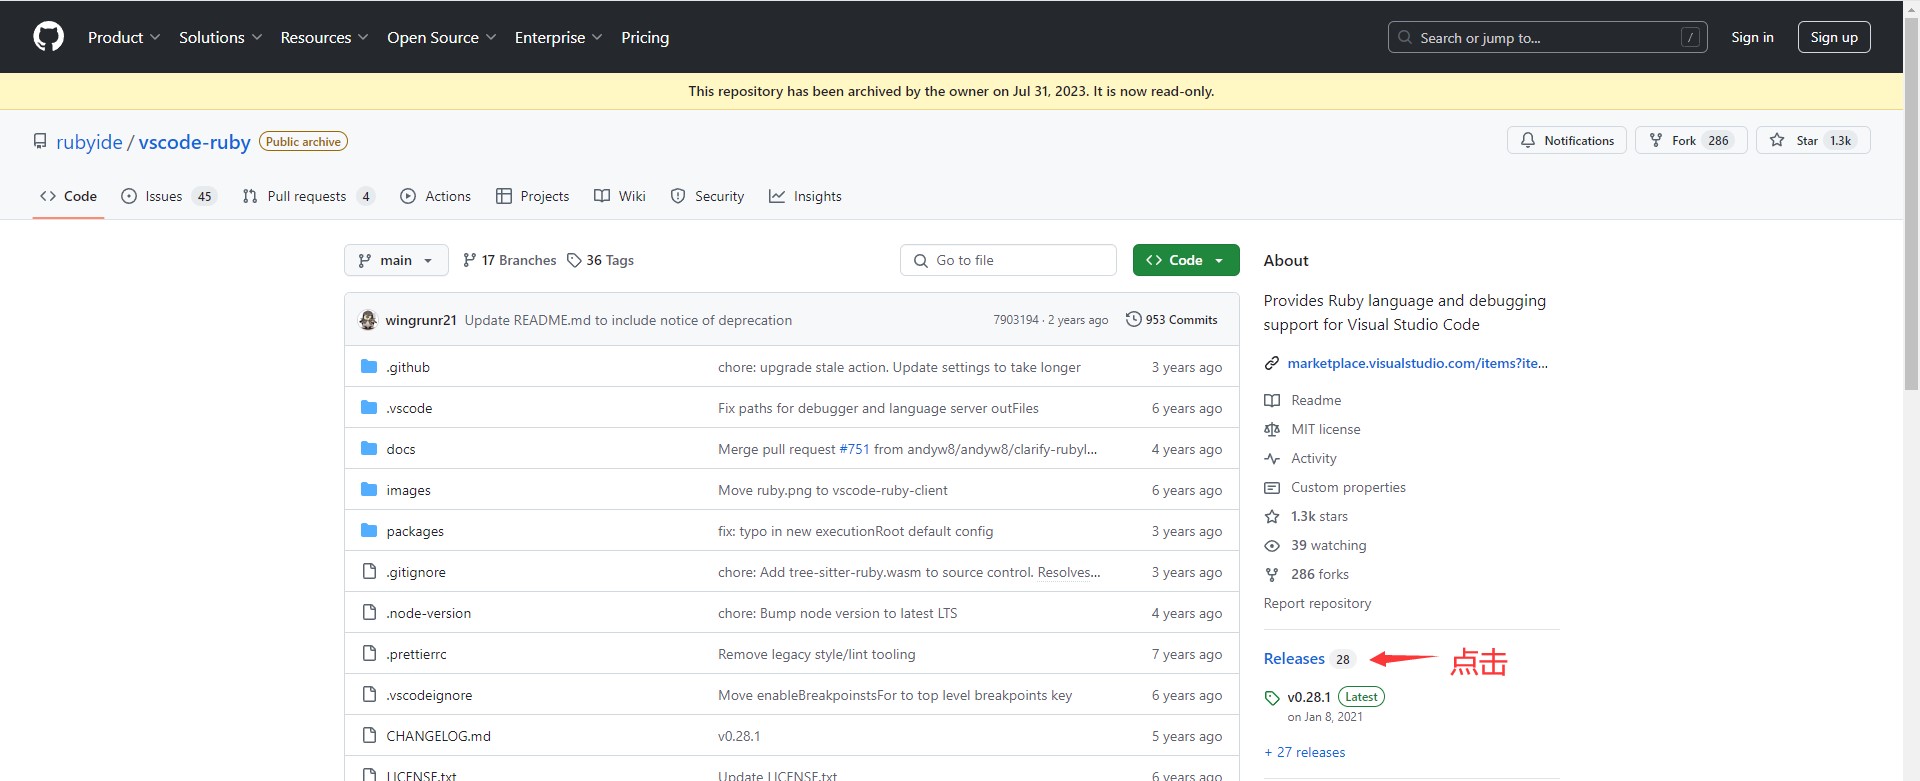
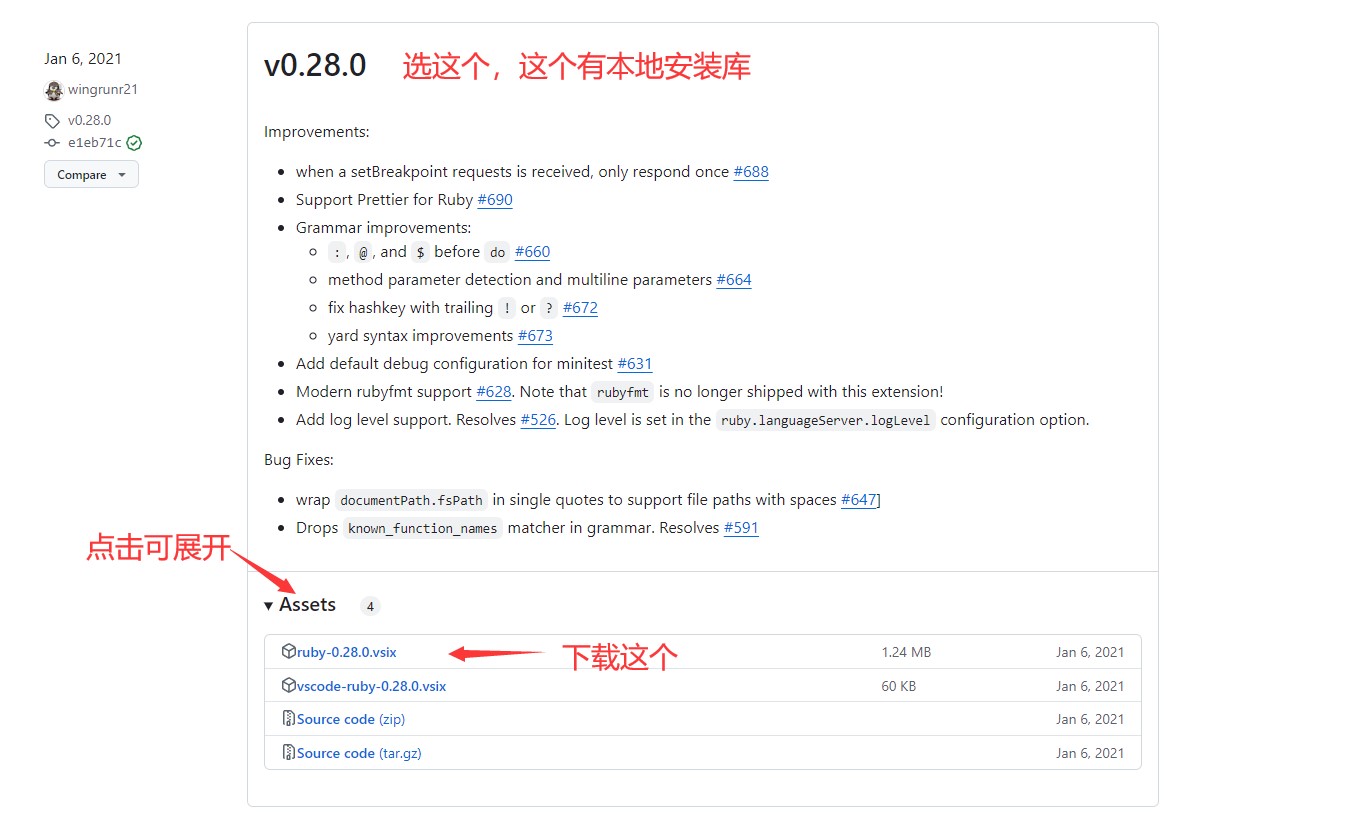
Download from GitHub
Select the version matching your SketchUp installation (2019 in this case) and place it in the SketchUp root directory (e.g., C:\Program Files\SketchUp\SketchUp 2019)
2. Install VSCode
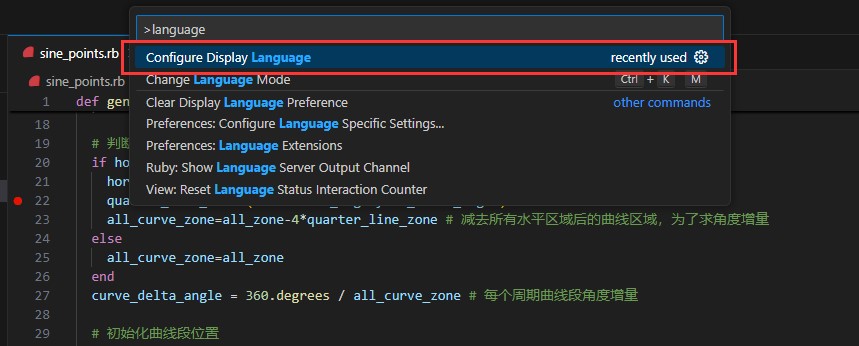
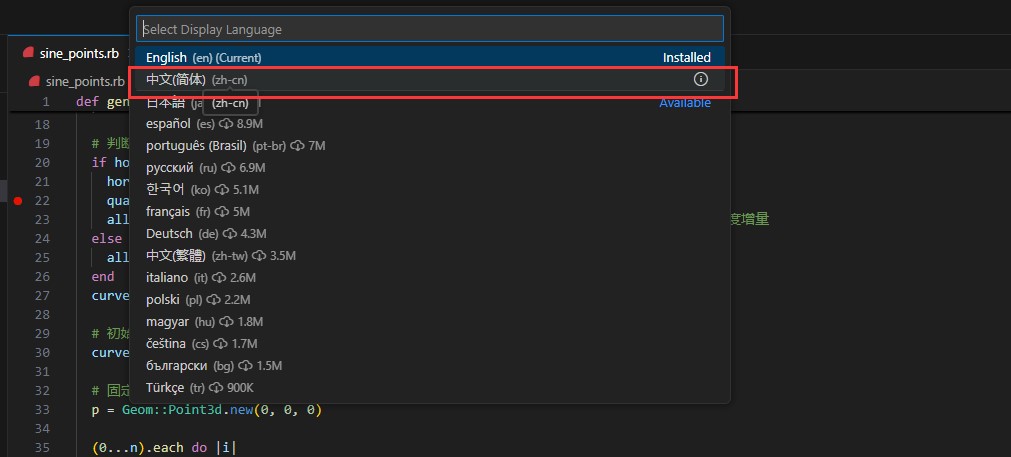
Download VSCode. After installation, change the UI language to Chinese by opening the Command Palette (Ctrl+Shift+P), searching for “Language”, selecting “Configure Display Language”, and choosing Chinese.
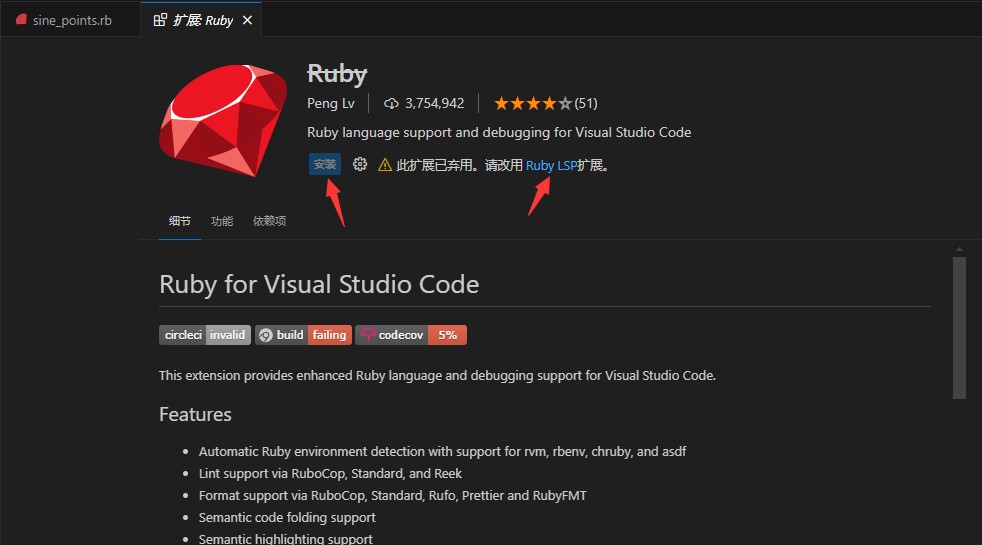
3. Install Ruby Extension in VSCode
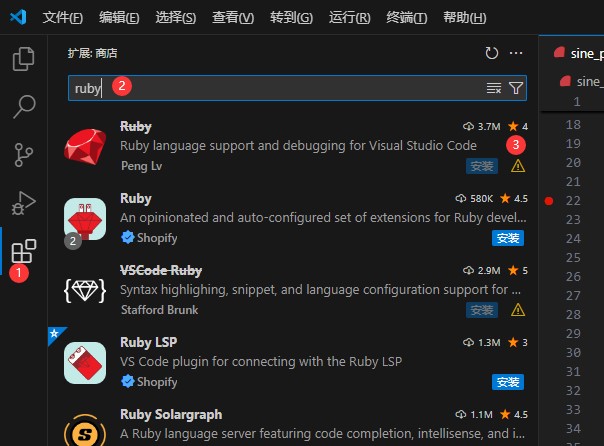
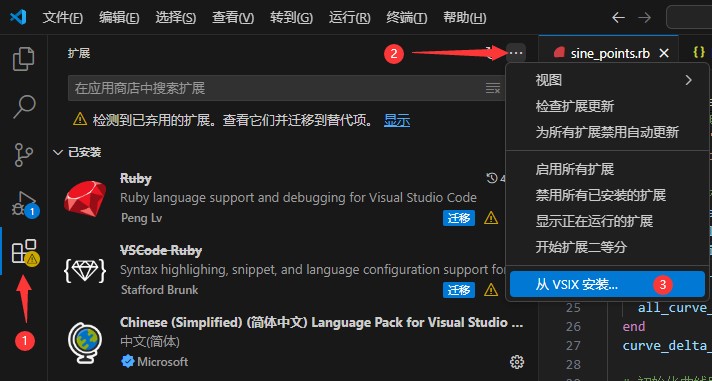
Click the Extensions icon (four squares) in the activity bar or use Ctrl+Shift+X to open the extensions marketplace. Search for “Ruby”.
You’ll see a deprecation notice recommending Ruby LSP - DO NOT install Ruby LSP as it will cause configuration issues with launch.json.
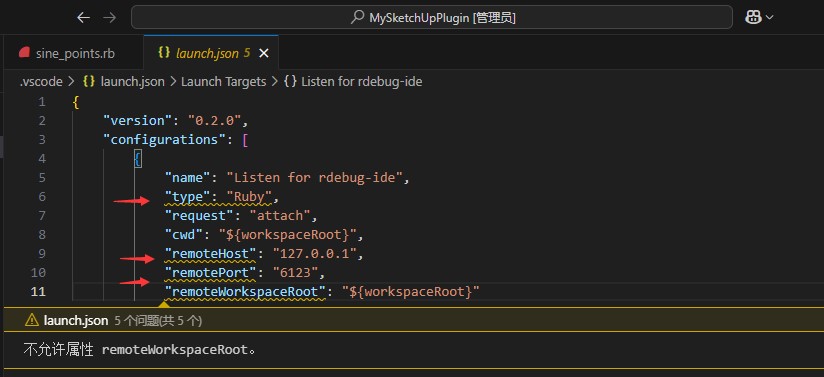
Here’s what happens if you install Ruby LSP (shows “property not allowed” errors) - I spent two days troubleshooting this:
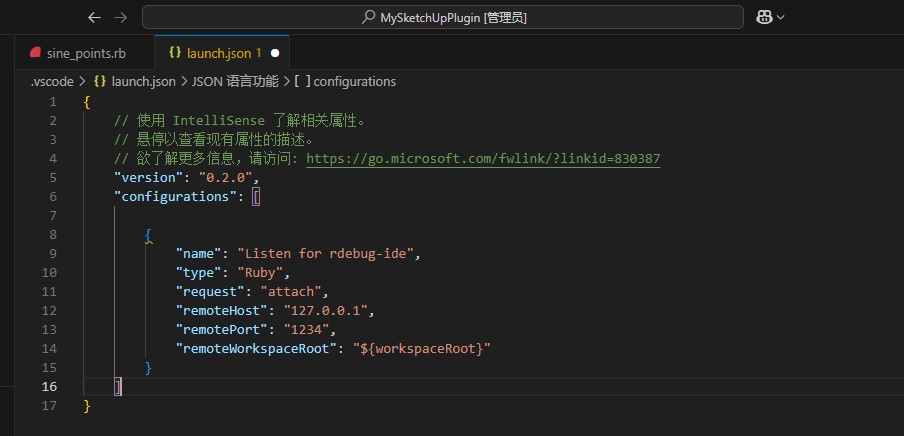
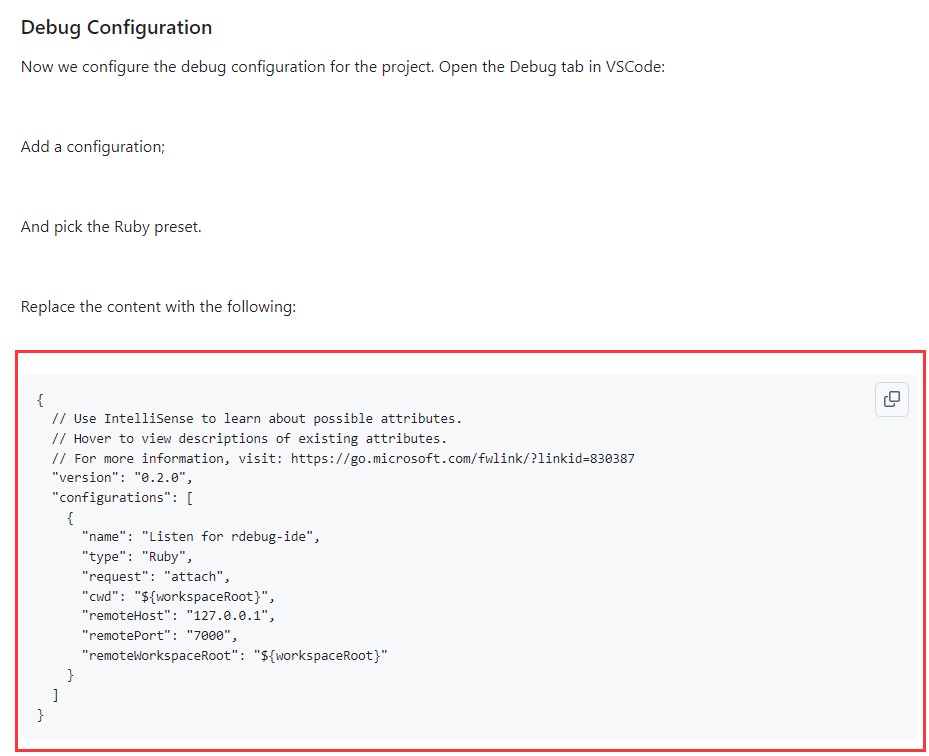
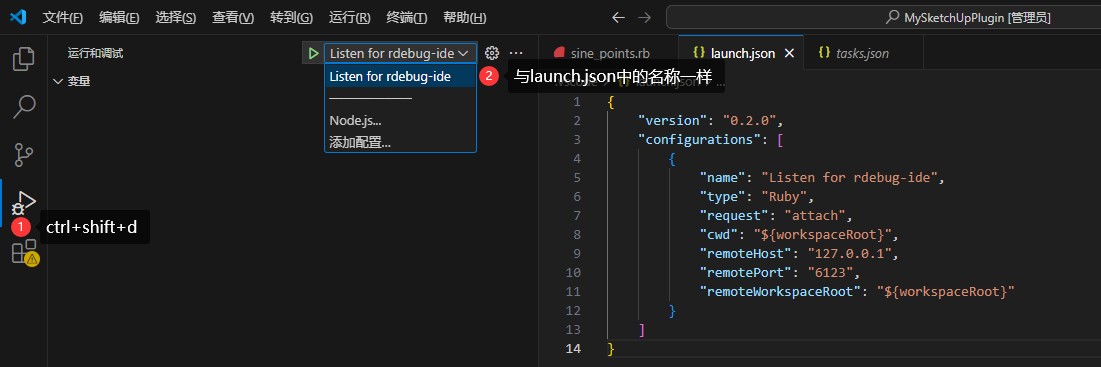
{"version":"0.2.0","configurations":[{"name":"Listen for rdebug-ide","type":"Ruby","request":"attach","cwd":"${workspaceRoot}","remoteHost":"127.0.0.1","remotePort":"6123","remoteWorkspaceRoot":"${workspaceRoot}"}]}
6. Synchronize File Paths
My plugin path (F:\MySketchUpPlugin) differs from SketchUp’s plugin directory (C:\Users...\Plugins).
(Solution: Create dev_loader.rb in SketchUp plugins folder , Principle: SketchUp automatically loads all .rb files in the Plugins directory upon startup. The dev_loader.rb script adds your development directory to Ruby’s load path and actively loads the specified file.)
# Location: C:\Users\...\Plugins\dev_loader.rbdev_path="F:/MySketchUpPlugin"# Your actual path# Add dev directory to load path$LOAD_PATH.unshift(dev_path)unless$LOAD_PATH.include?(dev_path)# Auto-load main pluginrequireFile.join(dev_path,'sine_points.rb')puts"Dev mode activated: Loading plugin from #{dev_path}"
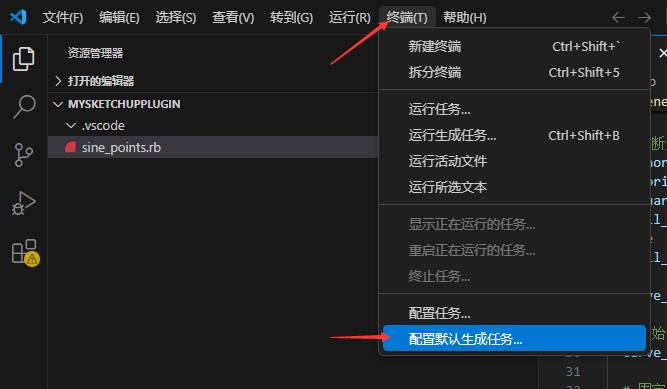
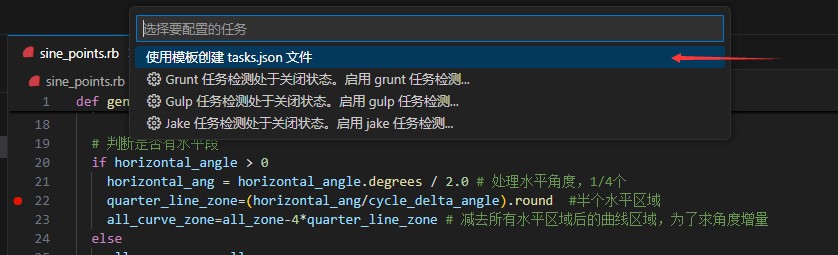
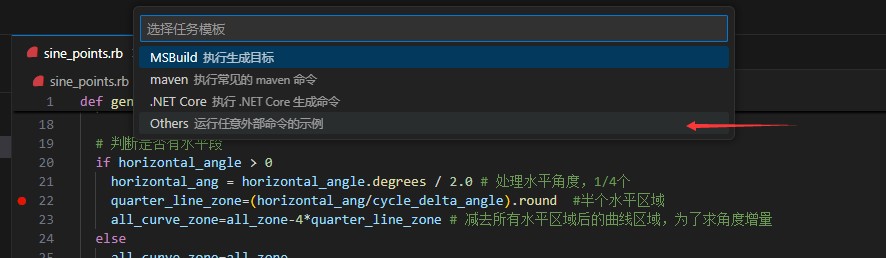
7. Testing Workflow
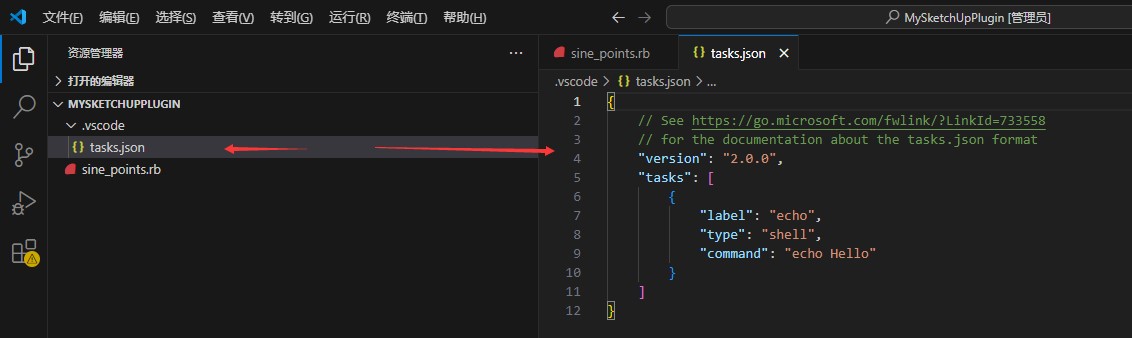
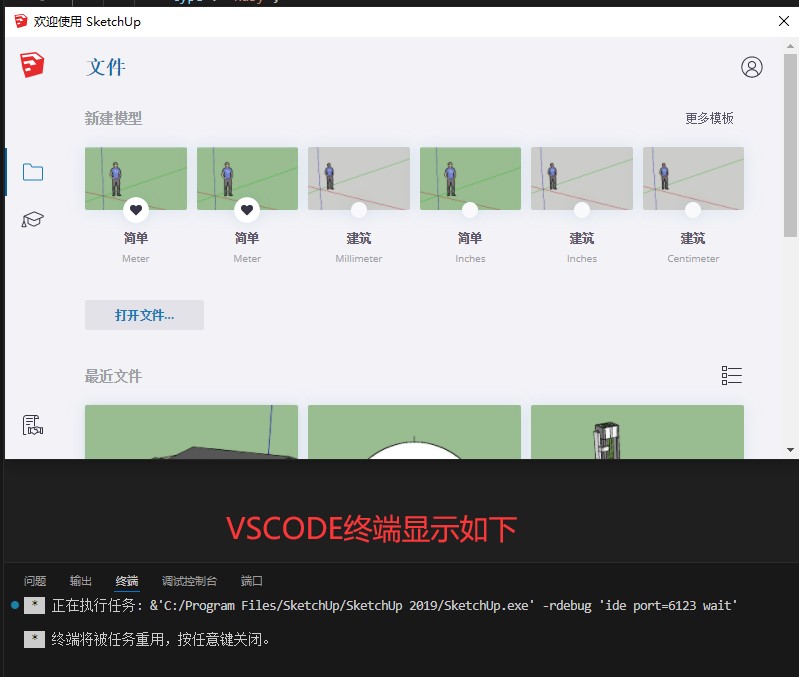
Run build task (Ctrl+Shift+B) - SketchUp will appear frozen
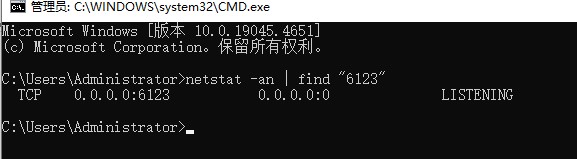
Check port status:
netstat -an | find "6123"
This indicates a service is listening on port 6123 across all network interfaces (0.0.0.0:6123 means the port is open to all IP addresses). This confirms SketchUp has successfully launched and is actively listening on the designated debugging port.
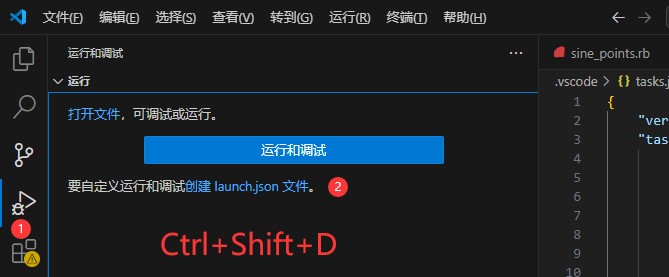
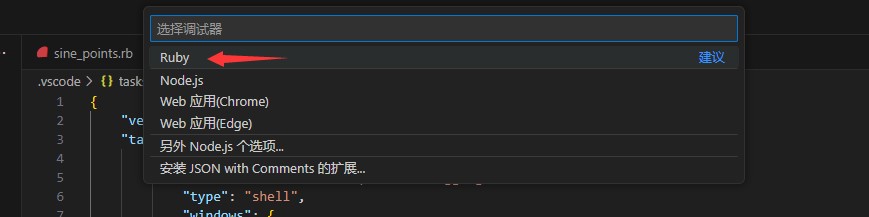
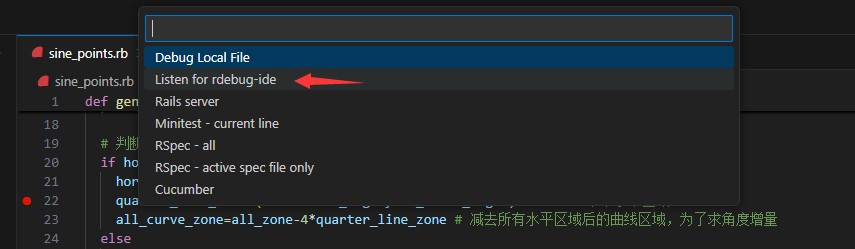
Start debugger (Ctrl+Shift+D) - select “Listen for rdebug-ide”
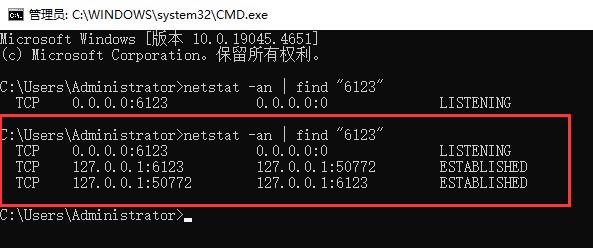
Check port connection:
netstat -an | find "6123"
This shows SketchUp is listening on port 6123 across all network interfaces (0.0.0.0:6123), with an established connection. This confirms the SketchUp debugging service is running, where both connections represent the same TCP session from different perspectives.
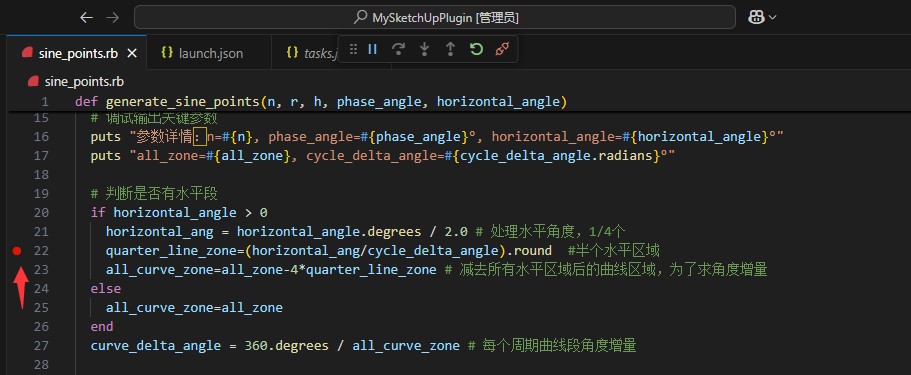
Set breakpoints and test
Breakpoint
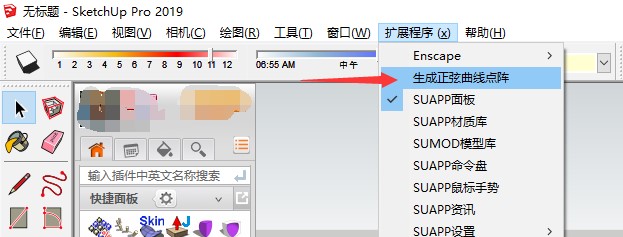
Plugin
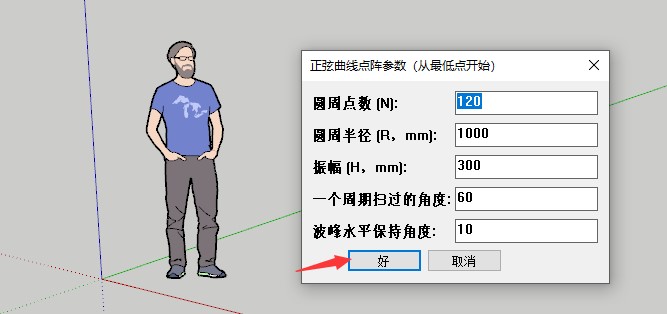
Triggered
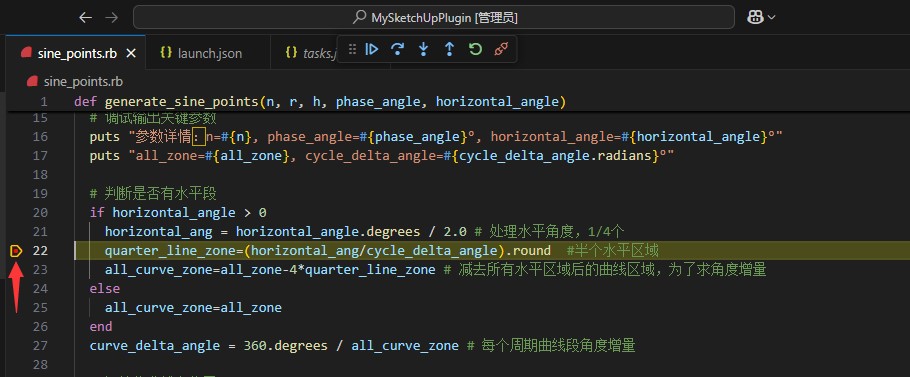
Hit
Success
8. Happy Coding!
AI tools have greatly expanded creative potential for individual developers!